Canmore Real Estate Market Update: September 2026
The September 2026 Canmore real estate market update, built on CREB® board figures for the first time: 44 sales, a $1,117,800 benchmark price, 161 active listings and 3.66 months of supply, plus what the portal numbers say and where they disagree.
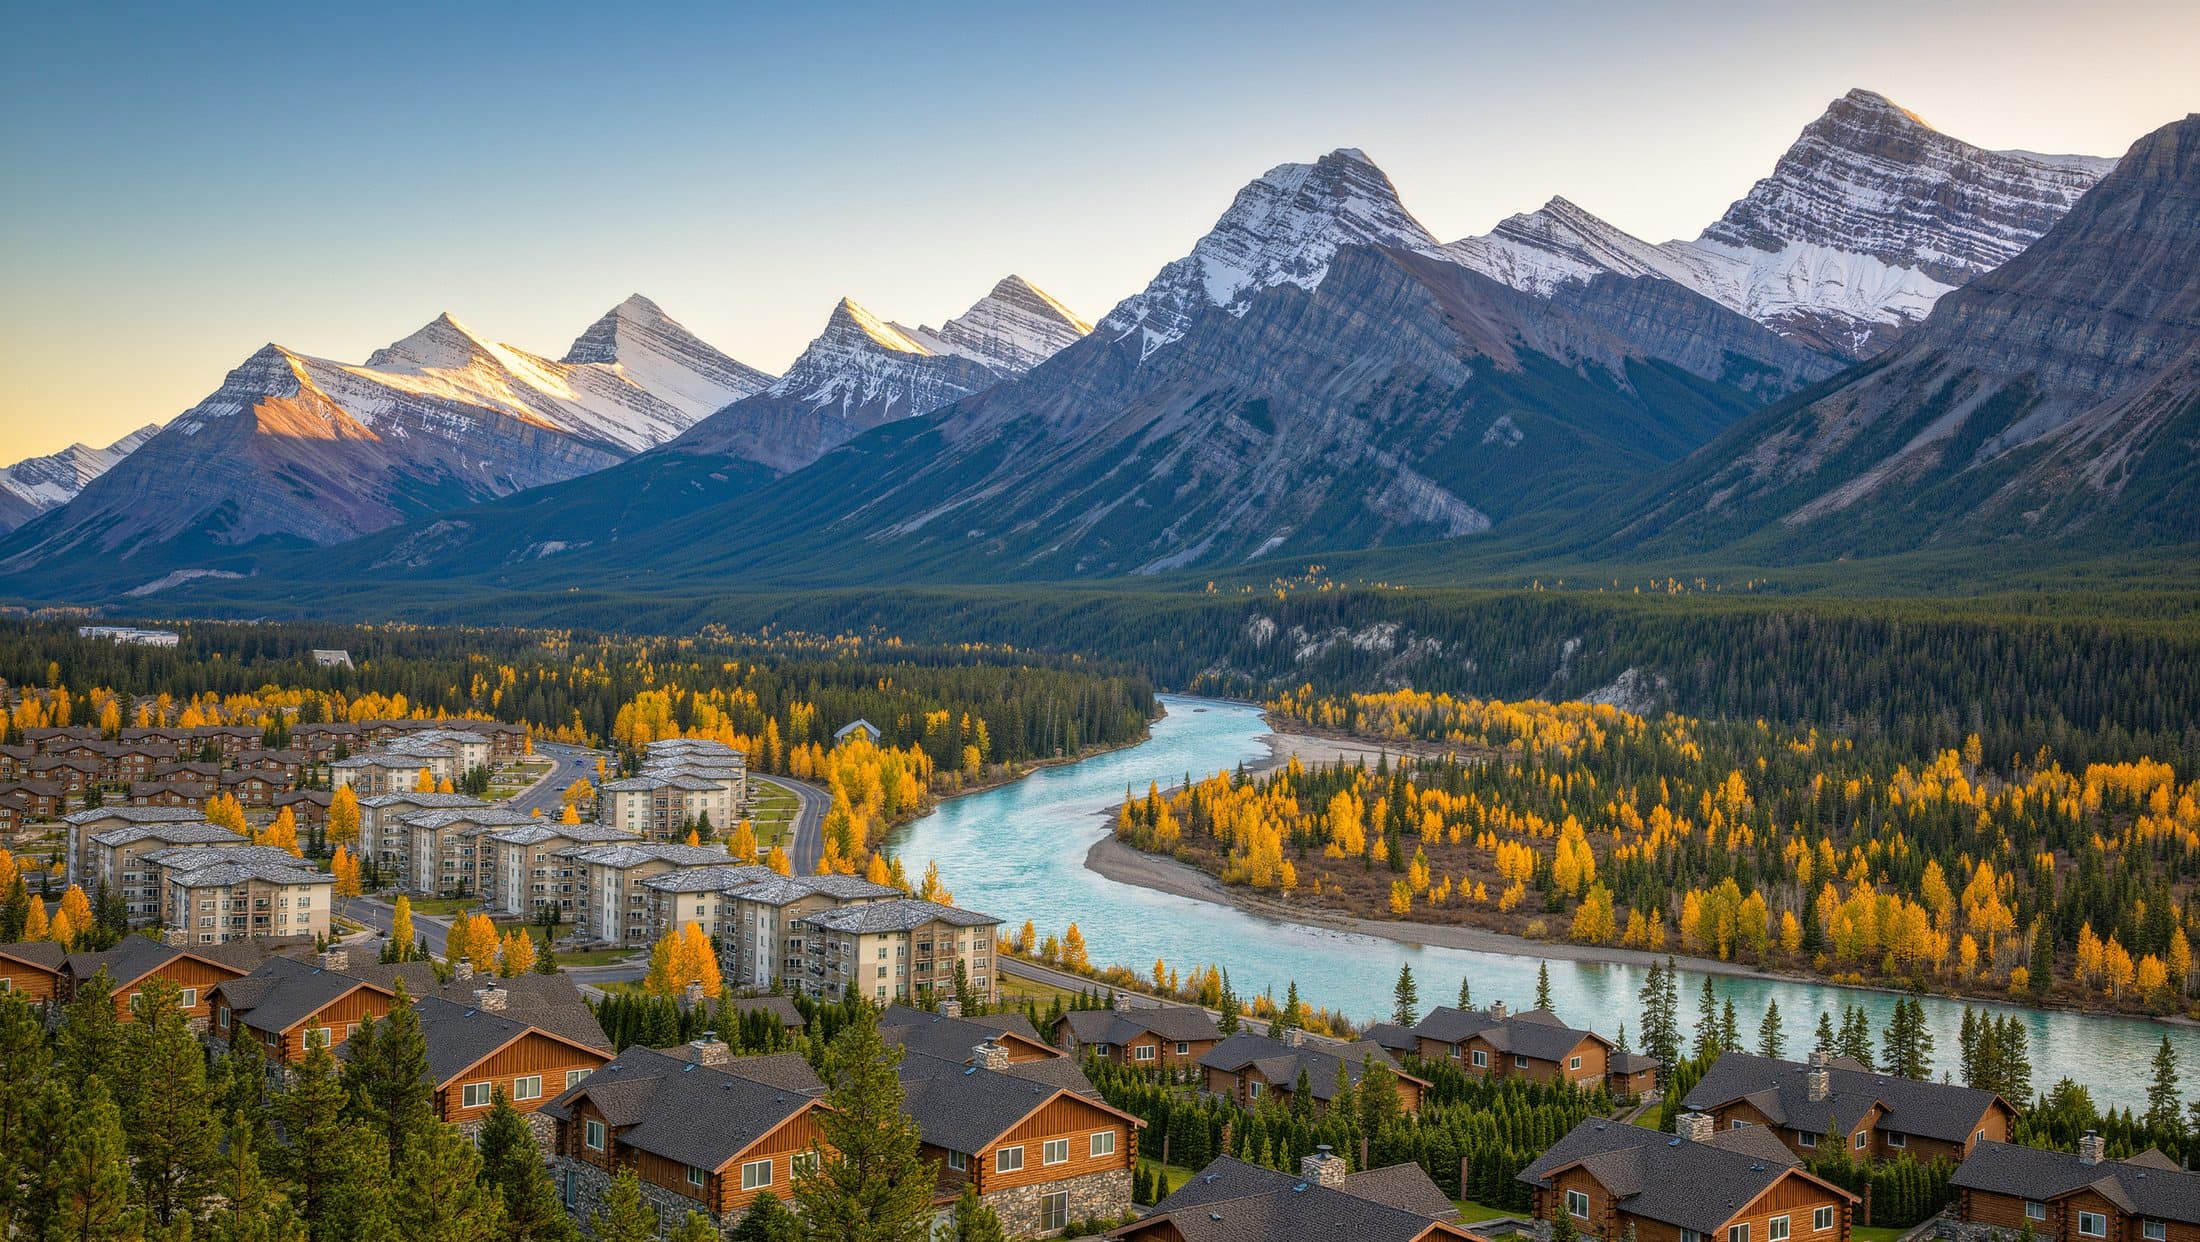
- September 2026: 44 sales against 22 a year earlier, a 100% year-over-year rise, on CREB® board data rather than portal estimates.
- The total residential benchmark price was $1,117,800, up 3.0% year over year, in the same month Calgary's benchmark fell about 1% to $566,700.
- Months of supply halved to 3.66 from roughly 7.7, which is balanced rather than tight. Inventory was 161, down only 4.7%.
- New listings rose 20.3% to 77, the highest of the three summer months, so buyers had more to choose from, not less.
- CREB® publishes no average price, median or days on market for Canmore alone. Those come from the wider Bighorn Region or from portals, and this page labels which is which.
This Canmore real estate market update covers September 2026 closings. It is the first of these reports built on CREB® board figures for Canmore rather than portal compilations, because CREB® publishes a dedicated Canmore page in its monthly regional package. Board data first, portal estimates second and labelled, and no number here is blended between the two.
- Sales, September 2026
- 44
- vs 22 in September 2025 · CREB® (board)
- Benchmark price
- $1,117,800
- +3.0% year over year · CREB® (board)
- Inventory, month end
- 161
- −4.7% year over year · CREB® (board)
- Months of supply
- 3.66
- from roughly 7.7 a year earlier · CREB® (board)
- New listings
- 77
- +20.3% year over year · CREB® (board)
- Year to date sales
- +11.0%
- against the same period in 2025 · CREB® (board)
Twice the sales, and the shelves stayed full
September's 44 sales were double the 22 of September 2025, the strongest September since 2022 on CREB®'s ten-year chart. The interesting part is what did not happen: inventory fell only 4.7%, to 161 listings, because new listings rose 20.3% to 77 and kept pace with the buying.
That combination is why months of supply halved, from roughly 7.7 to 3.66, without the market tipping into scarcity. Three to four months is the balanced band. A year ago Canmore was sitting in buyer's-market territory on the same measure; today it is not, and it is not a seller's market either.
| CREB® Canmore | July 2026 | August 2026 | September 2026 |
|---|---|---|---|
| Sales | 48 | 39 | 44 |
| New listings | 68 | 50 | 77 |
| Inventory | 154 | 145 | 161 |
| Months of supply | 3.21 | 3.72 | 3.66 |
| Benchmark price | $1,110,800 | $1,106,200 | $1,117,800 |
Prices firmed while Calgary's slipped
The total residential benchmark price reached $1,117,800, up 3.0% year over year. In the same month Calgary's benchmark fell about 1% to $566,700 on 1,650 sales. Canmore is not tracking the provincial centre, which is the whole argument for treating it as its own market: the valley floor cannot expand, and roughly a quarter of the housing belongs to people who live elsewhere.
Pace matters more than direction here. A 3.0% rise over twelve months is a firm market, not a hot one, and it is well below the roughly 8% of 2025.
What CREB® does not publish for Canmore
CREB®'s Canmore page carries sales, new listings, inventory, months of supply and the benchmark price. It does not publish an average price, a median, days on market or a sale-to-list ratio for the town on its own. Anyone quoting those as "board data for Canmore" is quoting something else.
Two honest substitutes, both labelled:
| Figure | Value | What it actually covers |
|---|---|---|
| Average price | $1,148,714 | CREB® Bighorn Region, which adds Exshaw, Dead Man's Flats, Harvie Heights, Lac des Arcs and Kananaskis to Canmore |
| Median price | $1,060,000 | CREB® Bighorn Region, as above |
| Median sold price | $1,200,000 | Wahi, a portal estimate with its own methodology |
| Days on market | 56 | Wahi, portal estimate. CREB® publishes none for Canmore |
| Active listings | 145 | Wahi, portal estimate, against CREB®'s 161 |
The Bighorn Region recorded 49 sales against Canmore's 44, and 198 listings against 161, so roughly five sales and 37 listings sat outside the town. That is the size of the error if you treat the regional average as a Canmore number.
Where September's sales actually happened
CREB®'s price-range chart for Canmore puts 13 of the month's sales between $1,000,000 and $1,499,999 and 12 at $1,500,000 or more. That is 25 of 44 sales at $1 million and up, against a benchmark of $1,117,800: the benchmark describes a typical home, and in Canmore a typical home is a seven-figure one.
Below that line the activity sits in apartments and row housing, which is the part of the market a buyer under about $900,000 is actually shopping. The detached segment is small in any single month here, so one or two unusual sales swing its average. That is the reason this page leads with the benchmark and months of supply rather than an average price.
Year to date, which is the number that survives a quiet month
A single month in a town this size is a small sample: 44 sales is two a day. The year-to-date figures are steadier, and CREB® publishes them for the Bighorn Region.
| Bighorn Region, January to September 2026 | Value |
|---|---|
| Sales | 401 |
| New listings | 651 |
| Sales-to-new-listings ratio | 62% |
| Months of supply | 3.79 |
| Benchmark price | $1,066,533 |
| Average price | $1,223,576 |
| Median price | $1,060,000 |
Canmore's own year-to-date sales are up 11.0% and its new listings up 6.8%, so the year has brought more buyers and more sellers in roughly equal measure. A market that adds both at once is one where prices grind rather than jump, which is what the 3.0% benchmark move says.
How to read a benchmark price, and why it is not an average
The benchmark is the price of a typical home with typical characteristics, tracked over time so the figure is not dragged around by whatever mix happened to sell that month. An average is the arithmetic mean of actual sales, so three chalets above $3 million in a 44-sale month move it and tell you nothing about the condo you are looking at.
For Canmore the practical rule: use the benchmark to judge direction, use sold comparables for the specific building or street you are buying in, and treat any single month's average as noise. A local REALTOR® can pull those comparables from the board system; the portals cannot show them.
What this month changes for sellers
Three things in September's figures matter if you are listing. New listings rose 20.3%, so your home meets more competition than it would have a year ago. Months of supply fell to 3.66, so that competition is being absorbed. And the benchmark rose 3.0%, so the market supports a firm price but not an ambitious one.
Priced to the benchmark and the recent comparables, homes are selling. Priced to what a neighbour achieved in the 2022 peak, they are sitting, and on the portal measure the typical home still takes about eight weeks. If you are weighing a sale, the selling guide sets out what the process costs in Alberta.
Rates and the fall calendar
The Bank of Canada held its policy rate at 2.25% on 2 September 2026, the sixth consecutive hold of the year. The next decision is 28 October 2026. Financing costs are stable rather than falling, and nothing in September's data argues for waiting on a rate cut that may not come.
Three dates still matter before the year ends:
- 31 December 2026: the Livability Tax primary residence declaration. Miss it and your home is taxed at the non-primary rate, which is 0.833% against 0.457%.
- 31 December 2026: the fee waiver for converting a tourist home to residential ends.
- 1 January 2027: the federal foreign-buyer ban is set to expire.
Buy in the fall and the Livability Tax declaration still applies for the year. If the Town has no primary-residence declaration on file by 31 December, the home is billed at 0.833% rather than 0.457% of assessed value, and on a $1.1 million home that difference is roughly $4,100.
What this means if you're buying
More buyers transacted in September than in any September since 2022, and they did it without clearing the shelves. For a buyer that is the comfortable version of a busy market: competition is real but inventory held at 161, and the typical home still took around eight weeks to sell on the portal measure.
Under about $900,000 you are shopping condos and townhomes, which is where most of September's volume sat. Above $1.5 million the market is thinner and slower, and negotiating room survives there. If you want the full picture by property type before you book viewings, start with Canmore homes for sale and the buyer cost calculator.
The benchmark tells you the direction. What a specific building or street actually sold for comes from the board system, and a local REALTOR® can pull it for you.
Frequently asked
What happened in the Canmore real estate market in September 2026?
Forty-four residential sales closed, double the 22 of September 2025, and the total residential benchmark price reached $1,117,800, up 3.0% year over year (CREB®). Inventory ended the month at 161 listings and months of supply fell to 3.66 from roughly 7.7 a year earlier. New listings rose 20.3% to 77.
Is the Canmore market a buyer's or a seller's market right now?
Balanced, on the usual rule of thumb. At 3.66 months of supply the market sits in the band where neither side holds the whip, and the sales-to-new-listings ratio was about 57%. Prices firmed rather than jumped: the benchmark rose 3.0% over twelve months, which is slower than the 8% of 2025.
Why does this page show a benchmark price but not an average Canmore price?
Because CREB® does not publish one for Canmore alone. Its Canmore page carries sales, new listings, inventory, months of supply and the benchmark. Average and median prices are published only for the wider Bighorn Region, which includes Exshaw, Dead Man's Flats, Harvie Heights, Lac des Arcs and Kananaskis. Mixing the two would be misleading, so both are labelled here.
How does Canmore compare with Calgary in September 2026?
They moved in opposite directions. Canmore's benchmark rose 3.0% to $1,117,800 while Calgary's fell about 1% to $566,700 on 1,650 sales (CREB®). A Canmore home still costs roughly twice a Calgary one, and the gap between the two markets is set by supply that cannot expand, not by Calgary's cycle.
What is the difference between board data and portal estimates?
Board figures come from the MLS® System through CREB® and Pillar 9, and are what a local REALTOR® works from. Portals such as Wahi and Zolo publish their own compilations with different definitions and coverage, which is why their counts differ from the board's. This page leads with board data and labels every portal figure as an estimate.
- CREB®: Monthly Statistics Package, September 2026 (Canmore, page 12; Bighorn Region, page 3)
- CREB®: September 2026 housing statistics release
- Bank of Canada: policy rate announcement, 2 September 2026
- Wahi: Canmore housing market report (September 2026 data)
- Town of Canmore: Livability Tax Program, Primary Residence Declaration
- Town of Canmore: Tourist homes
Keep reading

Tell us what you’re looking for and get a straight answer, usually the same day. Free, and no obligation.